Issue analytics
- Tier: Premium, Ultimate
- Offering: GitLab.com, GitLab Self-Managed, GitLab Dedicated
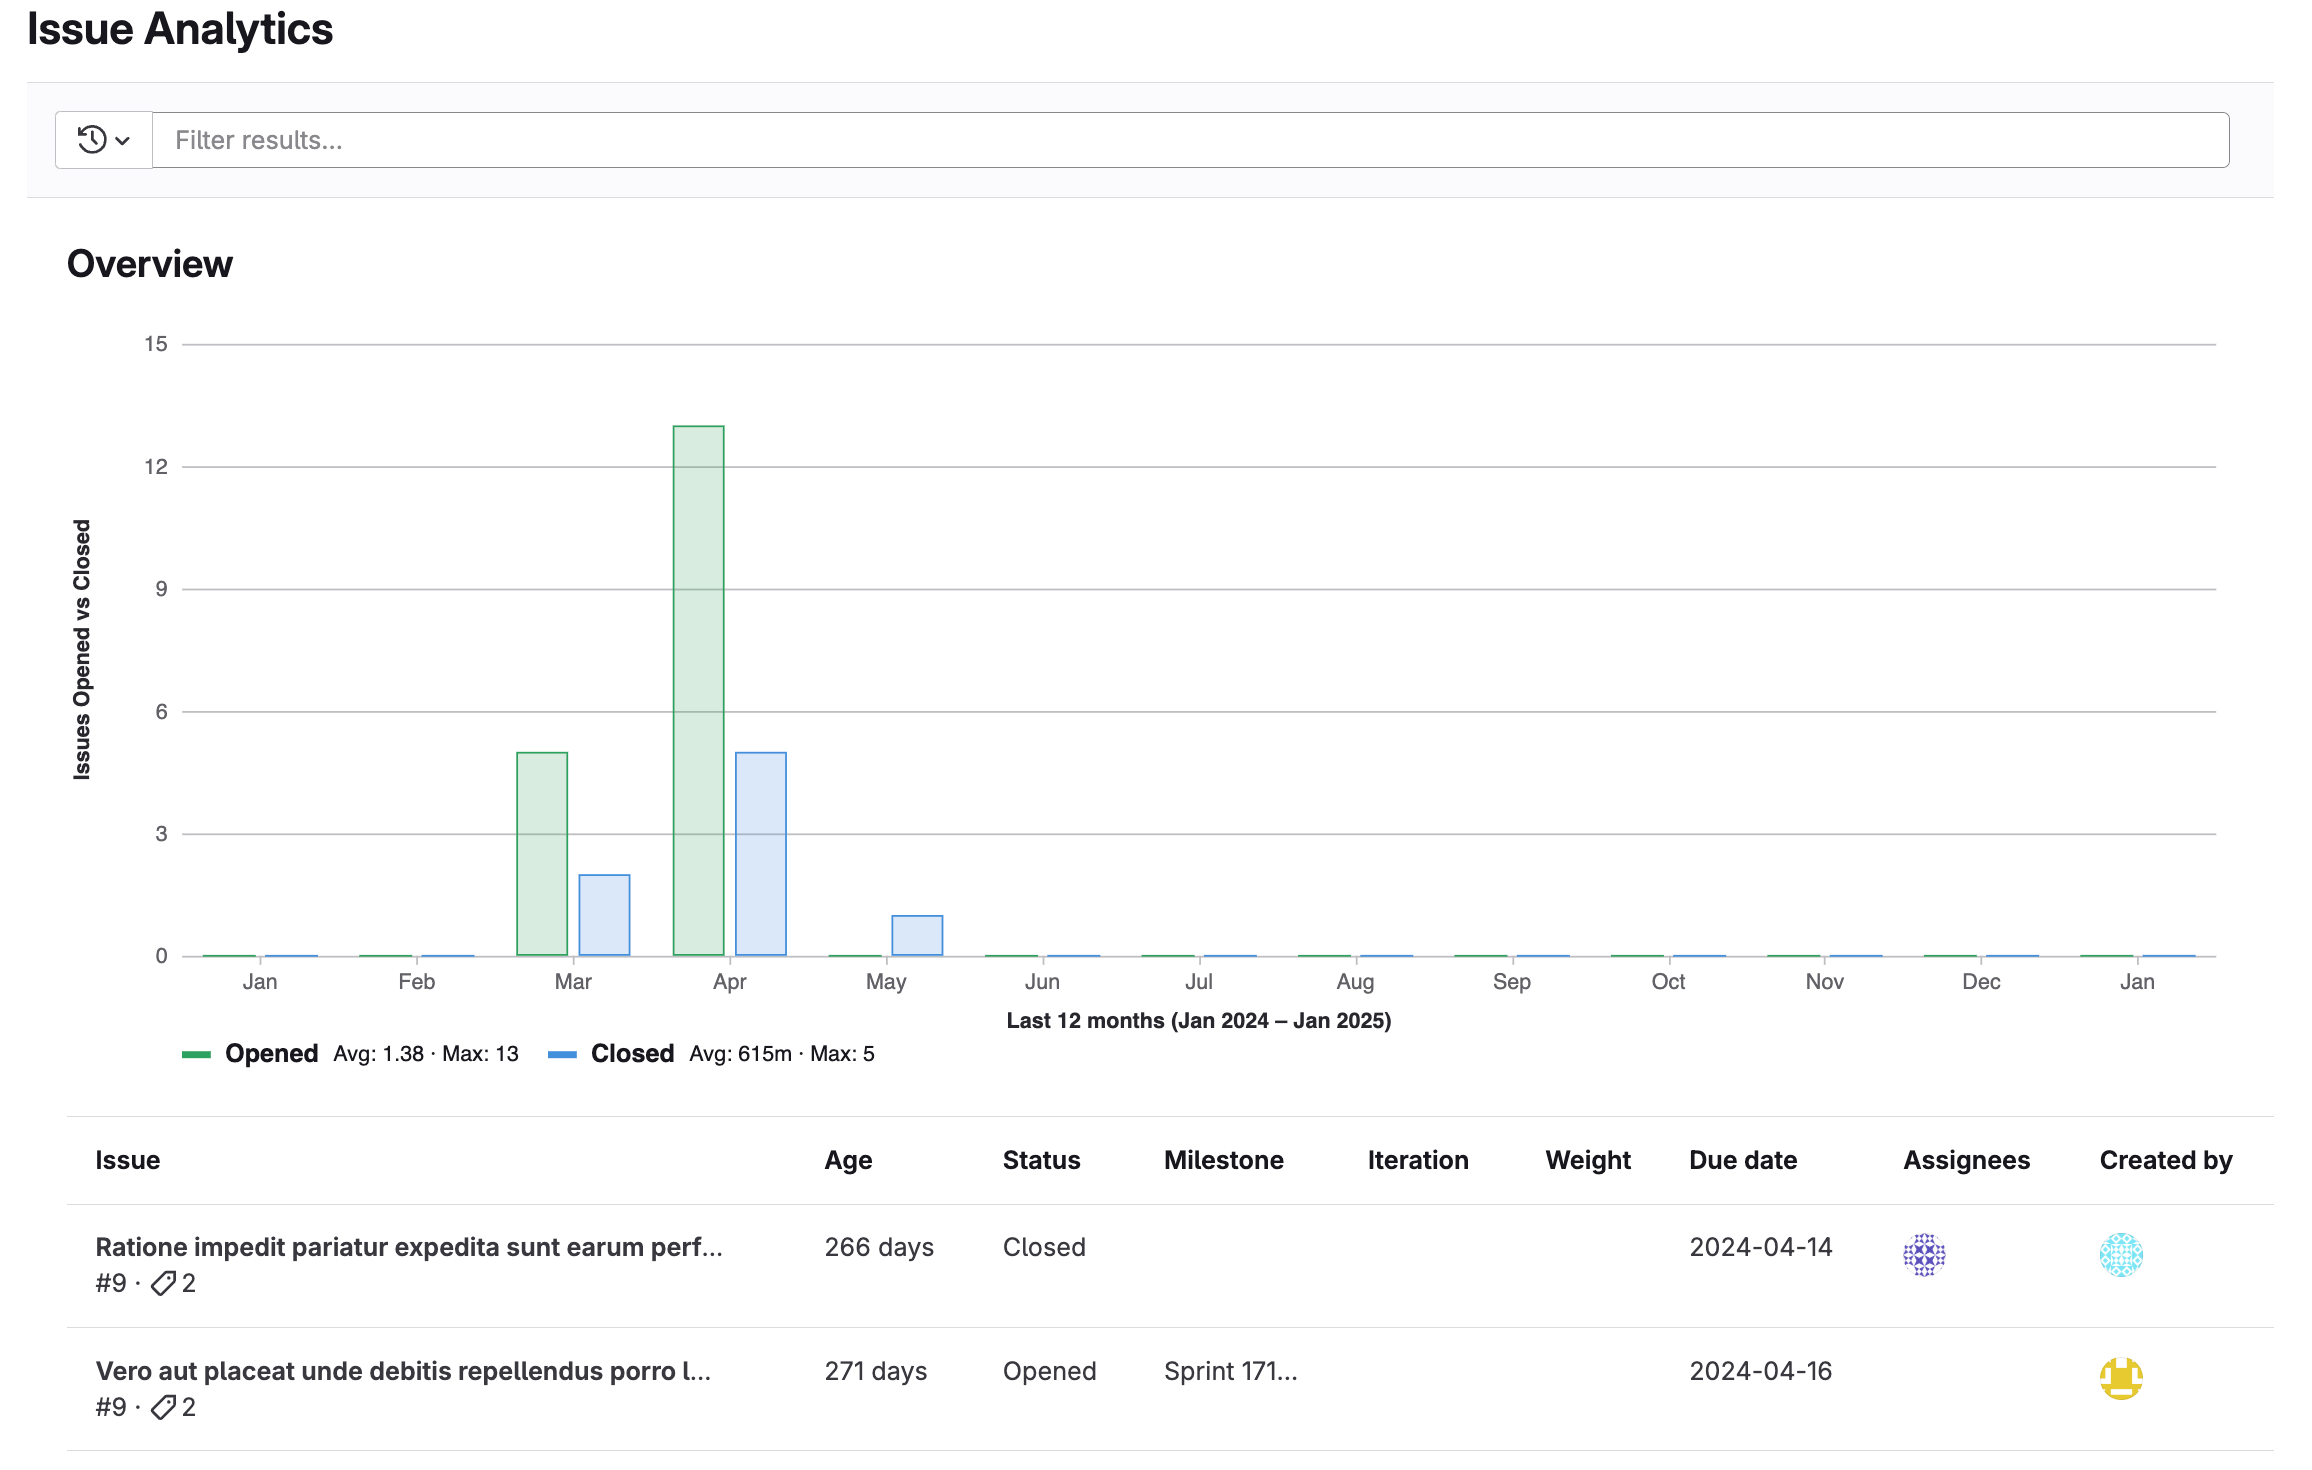
Issue analytics provide insights into the issues created each month in a group or project. A bar chart illustrates the number of issues opened and closed each month. A table displays the top 100 issues based on the global page filters, with the following details about each issue:
- Name
- Age
- Status
- Milestone
- Iteration
- Weight
- Due date
- Assignee
- Author
View issue analytics
To view issue analytics:
-
On the left sidebar, select Search or go to and find your project or group.
-
Select Analyze > Issue analytics. To view the total number of issues for a month, hover over a bar.
-
Optional. To filter the results, in Search or filter results text box, enter your criteria:
- Author
- Assignee
- Milestone
- Label
- My reaction
- Weight
-
Optional. To change the total number of months displayed, append the parameter
months_back=nto the URL. For example,https://gitlab.com/groups/gitlab-org/-/issues_analytics?months_back=15displays a chart with data for 15 months for the GitLab.org group.
You can also access issue analytics from the Value Streams Dashboard through the New issues drill-down report.
Enhanced issue analytics
- Tier: Ultimate
- Offering: GitLab.com, GitLab Self-Managed, GitLab Dedicated
Version history
-
Introduced in GitLab 16.3 with a flag named
issues_completed_analytics_feature_flag. Disabled by default. - Enabled on GitLab.com and GitLab Self-Managed in GitLab 16.8.
-
Feature flag
issues_completed_analytics_feature_flagremoved in GitLab 16.10.
Enhanced issue analytics display the additional metric Issues closed, which represents the total number of resolved issues in your group over a selected period.
You can use this metric to improve the overall turn-around time and value delivered to your customers.
