Newer
Older
Current status: [](https://gitlab.betapsi.tech/prismplex/latex-vorlage-semmelweis/commits/master)
**Licence: Use this template for what you want, but please mention the original author [LaTeX-Vorlage für Bachelor, Master und wissenschaftliche Arbeiten](https://github.com/a-czyrny/LaTeX-Master-Vorlage) and the modders `Thomas Winkler` and `Fabian Plank`.**
## Inhalt/Table of Content

- [(DE) Latex Vorlage zum Schreiben der Diplom-/Doktorarbeit an der Semmelweis Universität in Budapest](#de-latex-vorlage-zum-schreiben-der-diplom-doktorarbeit-an-der-semmelweis-universität-in-budapest)
    - [Times New Roman](#times-new-roman)
    - [Wie benutze ich die Vorlage?](#wie-benutze-ich-die-vorlage)
        - [Mit "Texmaker"](#mit-texmaker)
        - [Mit "Sharelatex" oder "Overleaf"](#mit-sharelatex-oder-overleaf)
- [(EN) Latex template for writing a thesis at Semmelweis university](#en-latex-template-for-writing-a-thesis-at-semmelweis-university)
        - [With "Texmaker"](#with-texmaker)
        - [With "Sharelatex" or "Overleaf"](#with-sharelatex-or-overleaf)
- [Great examples](#great-examples)
    - [Line graph](#line-graph)
    - [Bar charts](#bar-charts)
    - [Stacked bar charts](#stacked-bar-charts)
    - [Pie charts](#pie-charts)
    - [Two y-Axes](#two-y-axes)
    - [Text replacement](#text-replacement)
    - [Electronic circuits](#electronic-circuits)

---
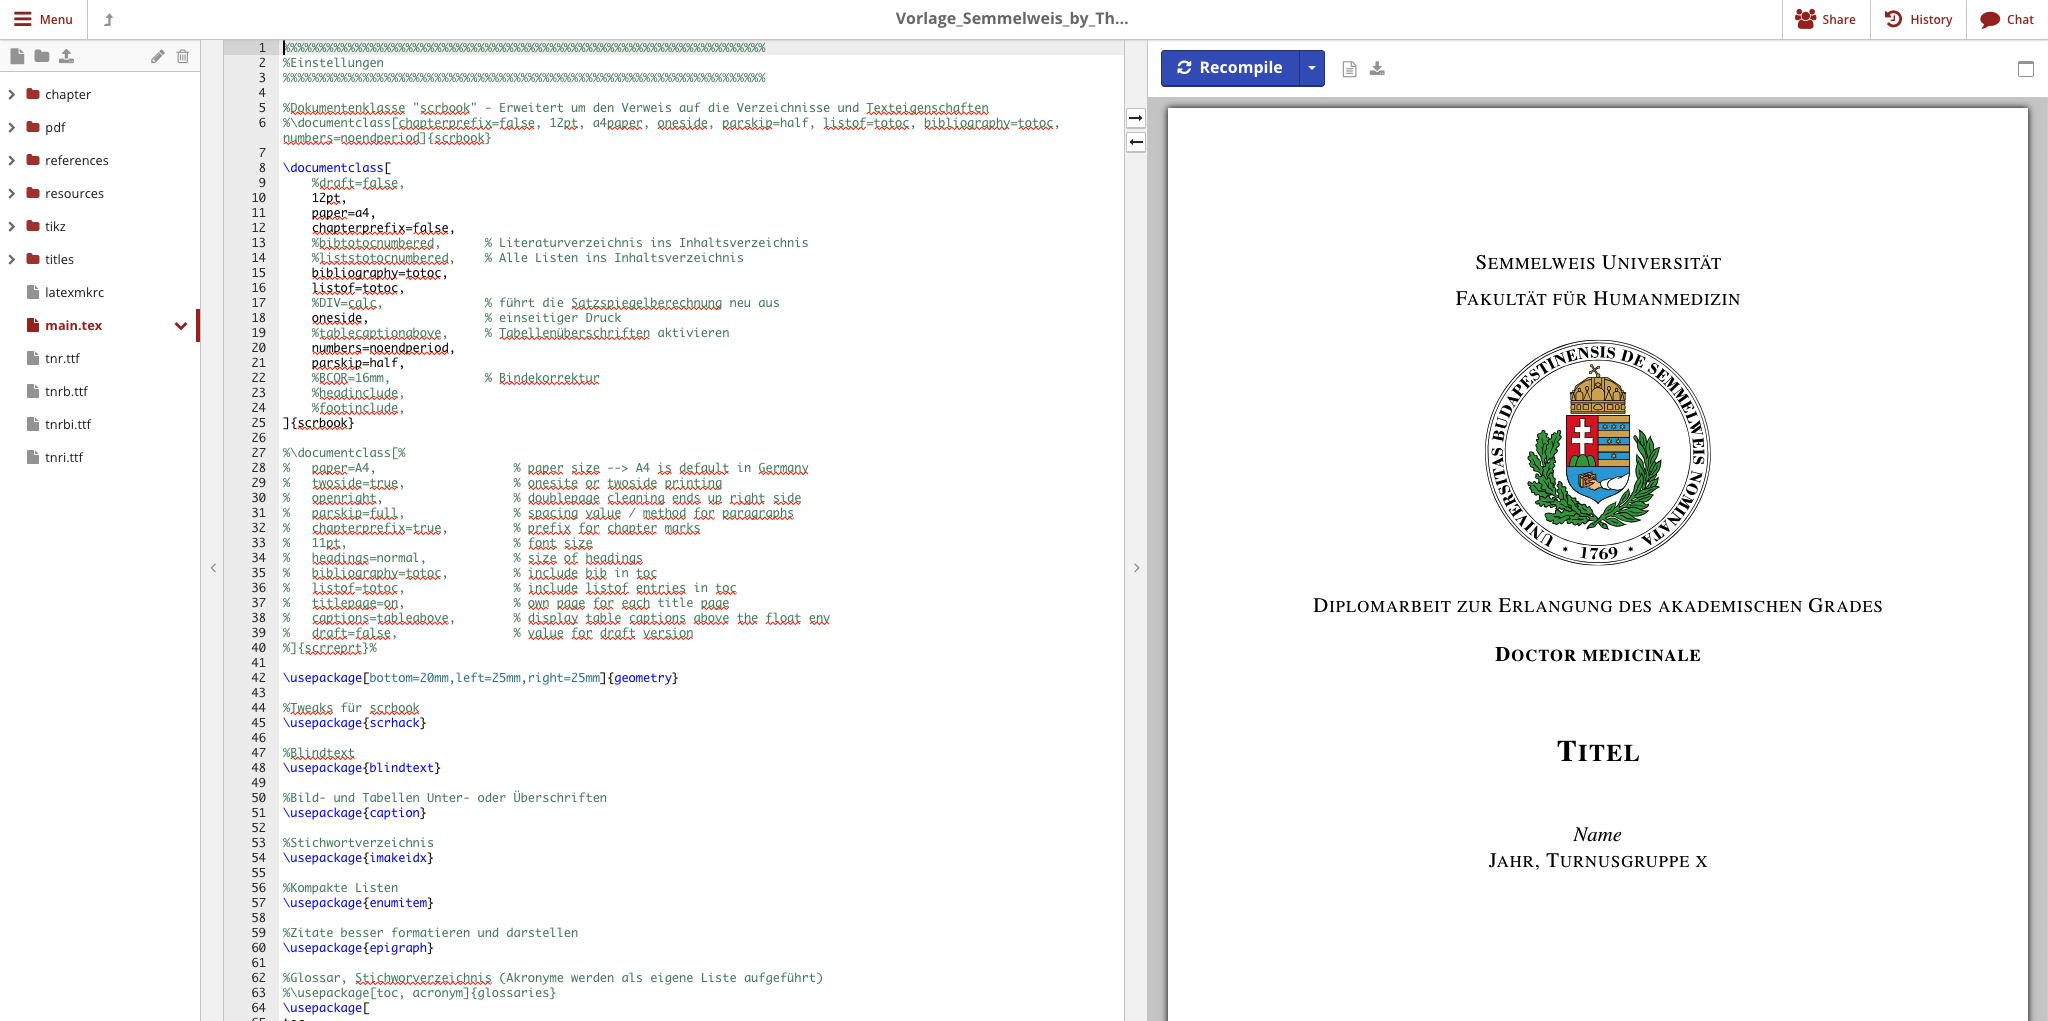
# (DE) Latex Vorlage zum Schreiben der Diplom-/Doktorarbeit an der Semmelweis Universität in Budapest

Quelle für das Logo der Semmelweis Universität: [Logo](https://commons.wikimedia.org/wiki/File:Logo_univsemmelweis.svg)
Dies ist eine von Thomas Winkler erstellte Vorlage zur Anfertigung einer Diplom-/Doktorarbeit, die speziell die Layoutvorgaben der Semmelweis Universität Budapest berücksichtigt
Der ursprüngliche Code entstammt dem Projekt [LaTeX-Vorlage für Bachelor, Master und wissenschaftliche Arbeiten](https://github.com/a-czyrny/LaTeX-Master-Vorlage).
Der Beispieltext ist aus meiner Diplomarbeit mit dem Thema „Pathogene, Diagnostik und Therapie der supraventrikulären Tachykardien“ entnommen, die ich im Jahr 2019 abgegeben habe.
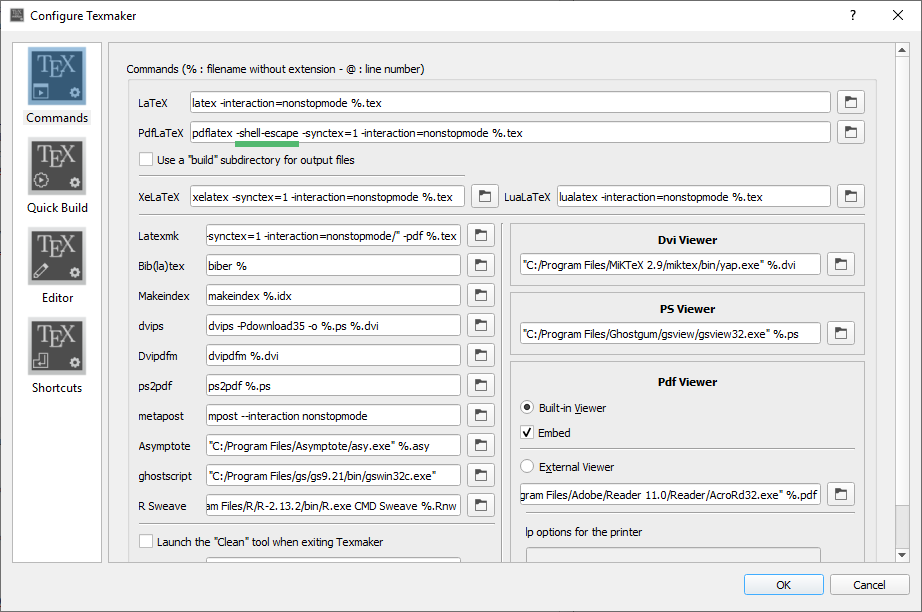
**Wichtig: Das Kompilieren muss mit dem Argument "-shell-escape" stattfinden!**
Das Argument "-shell-escape" ist in der Webversion von "Sharelatex" (neuerdings "Overleaf") standardmäßig aktiviert.
Wie man die Option in "Texmaker" aktiviert siehe weiter unten.
Aufgrund von Lizenzen konnte nicht die originale "Times New Roman"-Schriftart eingegliedert werden. Diese Projekt benutzt dagegen die Open-Source-Alternative "Liberation Serif".
Um die originale Schriftart einzugliedern, müssen diese vier Dateien im Stammverzeichnis ersetzt werden: `tnr.tff (regular Times New Roman), tnrb.tff (bold Times New Roman), tnrbi.tff (bold italic Times New Roman), tnri.tff (italic Times New Roman)`
Die originale "Times New Roman"-Schriftart wird mit Ausnahme von Linux-basierten Sytemen mit dem Betriebssystem mitgeliefert beziehungsweise ist standarmäßig installiert.
Unter "Mac OS X" findet man diese Dateien unter dem Pfad: `/Library/Fonts/` nach "Times New Roman" sucht.
Unter Windows findet man diese Dateien unter diesem Pfad: `C:\Windows\Fonts`
# Wie benutze ich die Vorlage?
## Mit "Texmaker"
1. ["MiKTeX" installieren](https://miktex.org/)

2. ["Texmaker" installieren](http://www.xm1math.net/texmaker/)
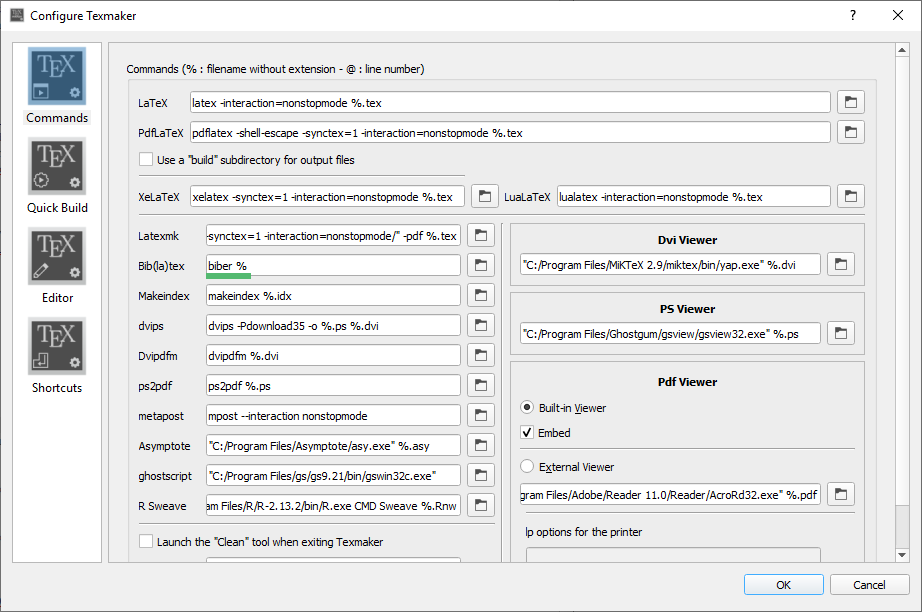
4. `-shell-escape` Argument zum pdflatex-Compiler hinzufügen
5. "Quick Build" Optionen zu `pdflatex + biblatex + 2x pdflatex + view pdf` ändern

## Mit "Sharelatex" oder "Overleaf"
Einfach die .zip Datei dieses Projekts downloaden und dort hochladen und du bist startklar!
# (EN) Latex template for writing a thesis at Semmelweis university

Source of the Semmelweis University logo: [logo](https://commons.wikimedia.org/wiki/File:Logo_univsemmelweis.svg)
This template was made by Thomas Winkler by using code from [LaTeX-Vorlage für Bachelor, Master und wissenschaftliche Arbeiten](https://github.com/a-czyrny/LaTeX-Master-Vorlage).
It considers the special layout requirements needed at Semmelweis University.
The used code is an extract from my original thesis with the title „Pathogene, Diagnostik und Therapie der supraventrikulären Tachykardien“ which was submitted 2019.
**Important: Compilation must be done with the "-shell-escape" argument!**
The "-shell-escape" argument is already activated in the web version of "Sharlatex" (recently "Overleaf").
## Times New Roman
Because auf licencing, the orginal "Times New Roman" font could not be integrated. Instead this project is using the open source alternative "Liberation Serif".
To change to the original "Times New Roman" just replace following file in the root directory:  `tnr.tff (regular Times New Roman), tnrb.tff (bold Times New Roman), tnrbi.tff (bold italic Times New Roman), tnri.tff (italic Times New Roman)`
The original "Times New Roman" font comes with all major operating systems (excluding linux systems, as I know they are using open source alternatives).
To find the font under "Mac OS X" go to `/Library/Fonts/` and search for "Times New Roman".
Windows uses this directory to store font files: `C:\Windows\Font`

# How to use
## With "Texmaker"
1. [Install "MiKTeX"](https://miktex.org/)

2. [Install "Texmaker"](http://www.xm1math.net/texmaker/)
3. Change the field Bib(la)tex from `biblatex` to `biber`


5. Change "Quick Build" options to `pdflatex + biblatex + 2x pdflatex + view pdf`

Just upload the downloaded .zip from here and you are ready to go!

---
# Great examples
Source: [TU Darmstadt LaTex Thesis Template](https://github.com/zemirco/tu-darmstadt-latex-thesis)
## Beautiful graphs
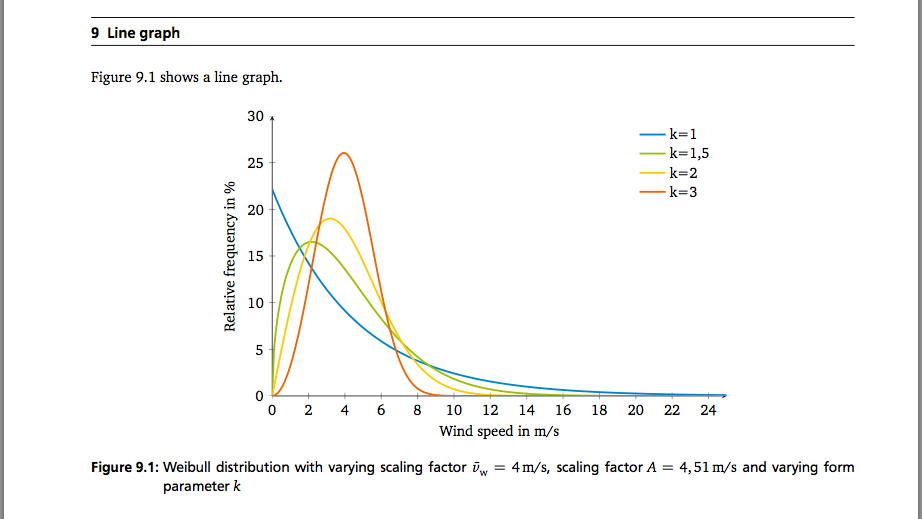
### Line graph
131
132
133
134
135
136
137
138
139
140
141
142
143
144
145
146
147
148
149
150
151
152
153
154
155
156
157
158
159
160
161
162
163
164
\begin{figure}[htb]
\centering
\begin{tikzpicture}
\begin{axis}[
xlabel= Wind speed in m/s,
ylabel= Relative frequency in \%,
xmin = 0,
xmax = 25,
ymin = 0,
ymax = 30,
width= 120mm,
height = 80mm,
%legend columns=-1,
axis x line = bottom,
axis y line = left,
legend style = {draw = none, cells={anchor=west}}
]
\addplot+[mark=none, blau_2b, very thick] file {data/weibull_k1.dat};
\addplot+[mark=none, gruen_4b, very thick] file {data/weibull_k1_5.dat};
\addplot+[mark=none, orange_6b, very thick] file {data/weibull_k2.dat};
\addplot+[mark=none, rot_8b, very thick] file {data/weibull_k3.dat};
\legend{k=1, {k=1,5}, k=2, k=3}
\end{axis}
\end{tikzpicture}
\caption[Weibull distribution with varying scaling factor]{Weibull distribution with varying scaling factor $\bar v_\textnormal{w} = 4\,\textnormal{m/s}$, scaling factor $A = 4,51\,\textnormal{m/s}$ and varying form parameter $k$}
\label{fig:weibull_distribution}
\end{figure}
```
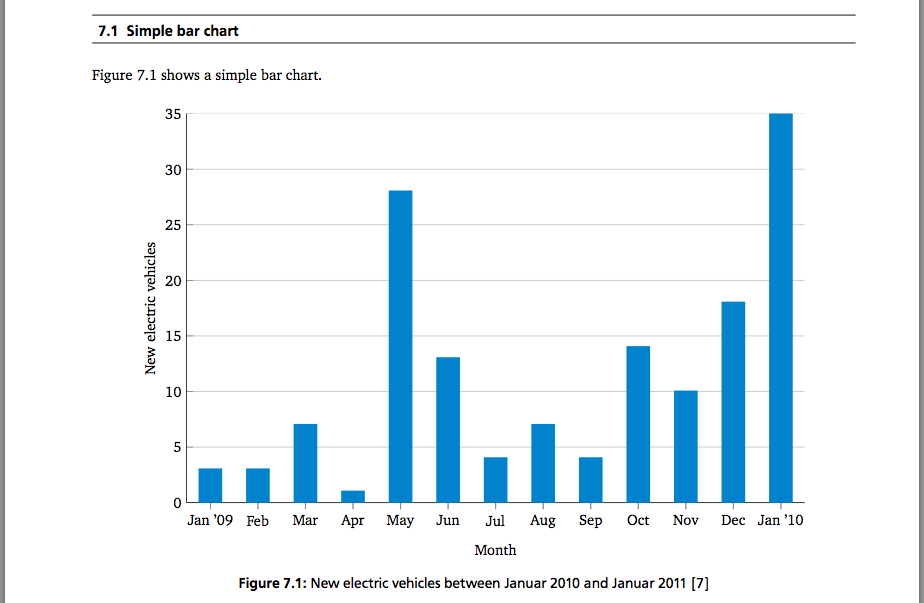
### Bar charts
166
167
168
169
170
171
172
173
174
175
176
177
178
179
180
181
182
183
184
185
186
187
188
189
190
191
192
193
194
195
196
197
198
199
200
201
202
203
204
205
206
207
208
209
210
211
212
\begin{figure}[htb]
\centering
\begin{tikzpicture}
\begin{axis}[
ybar,
xlabel = Month,
xmin = 0.5,
xmax = 13.5,
ymin = 0,
ymax = 35,
axis x line* = bottom,
axis y line* = left,
ylabel= New electric vehicles,
width= 0.9\textwidth,
height = 0.6\textwidth,
ymajorgrids = true,
bar width = 5mm,
xticklabels = \empty,
extra x ticks = {1,2,3,4,5,6,7,8,9,10,11,12,13},
extra x tick labels = {Jan '09, Feb, Mar, Apr, May, Jun, Jul, Aug, Sep, Oct, Nov, Dec, Jan '10},
]
\addplot+[mark=none, blau_2b, very thick] coordinates {
(1,3)
(2,3)
(3,7)
(4,1)
(5,28)
(6,13)
(7,4)
(8,7)
(9,4)
(10,14)
(11,10)
(12,18)
(13,35)
};
\end{axis}
\end{tikzpicture}
\caption[New electric vehicles between Januar 2010 and Januar 2011]{New electric vehicles between Januar 2010 and Januar 2011 \cite{sa-neuzulassungen}}
\label{fig:new_ev}
\end{figure}
```
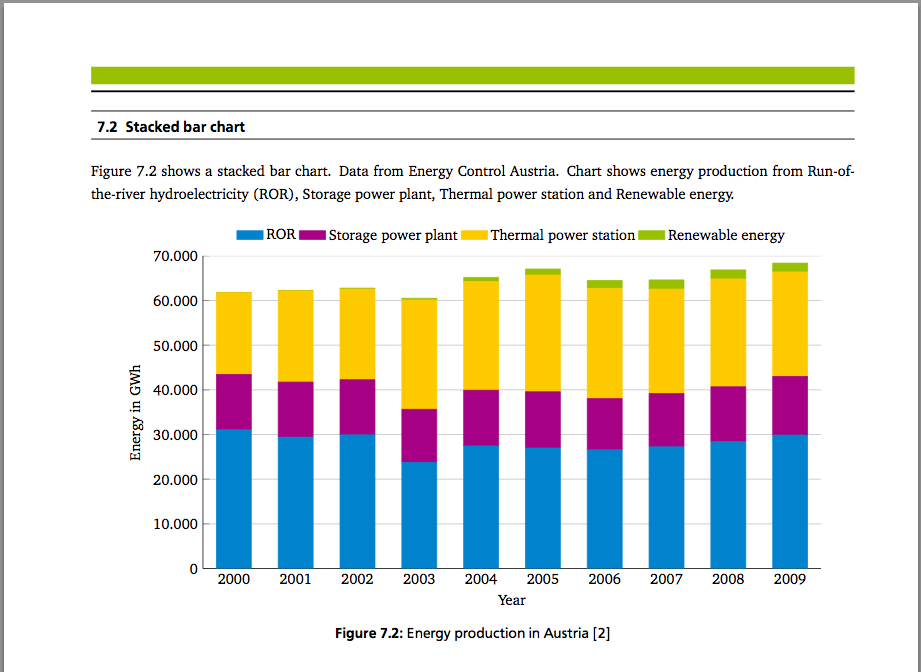
### Stacked bar charts
214
215
216
217
218
219
220
221
222
223
224
225
226
227
228
229
230
231
232
233
234
235
236
237
238
239
240
241
242
243
244
245
246
247
248
249
250
251
252
253
\begin{figure}[htb]
\centering
\begin{tikzpicture}
\begin{axis}[
ybar stacked,
xlabel= Year,
ylabel = Energy in GWh,
ymajorgrids = true,
width = 0.9\textwidth,
height = 0.5\textwidth,
xmin = 1999.5,
xmax = 2009.5,
ymin = 0,
ymax = 70000,
axis x line* = bottom,
axis y line* = left,
xticklabels = none,
extra x ticks = {2000, 2001, 2002, 2003, 2004, 2005, 2006, 2007, 2008, 2009},
extra x tick labels = {2000, 2001, 2002, 2003, 2004, 2005, 2006, 2007, 2008, 2009},
legend style = {at={(0.5, 1.025)}, anchor = south, legend columns = -1, draw=none, area legend},
area legend,
scaled ticks = false,
y tick label style = {/pgf/number format/use comma}
]
\addplot+[mark=none, fill=blau_2b, draw = blau_2b, bar width = 8mm] table[x=year, y=ror] {data/stacked-bar-chart.dat};
\addplot+[mark=none, fill=lila_10b, draw = lila_10b, bar width = 8mm] table[x=year, y=storage] {data/stacked-bar-chart.dat};
\addplot+[mark=none, fill=orange_6b, draw = orange_6b, bar width = 8mm] table[x=year, y=thermal] {data/stacked-bar-chart.dat};
\addplot+[mark=none, fill=gruen_4b, draw = gruen_4b, bar width = 8mm] table[x=year, y=renewable] {data/stacked-bar-chart.dat};
\legend{\gls{ROR}, Storage power plant, Thermal power station, Renewable energy}
\end{axis}
\end{tikzpicture}
\caption[Energy production in Austria]{Energy production in Austria \cite{econtrol2011}}
\label{fig:energy_austria}
\end{figure}
```
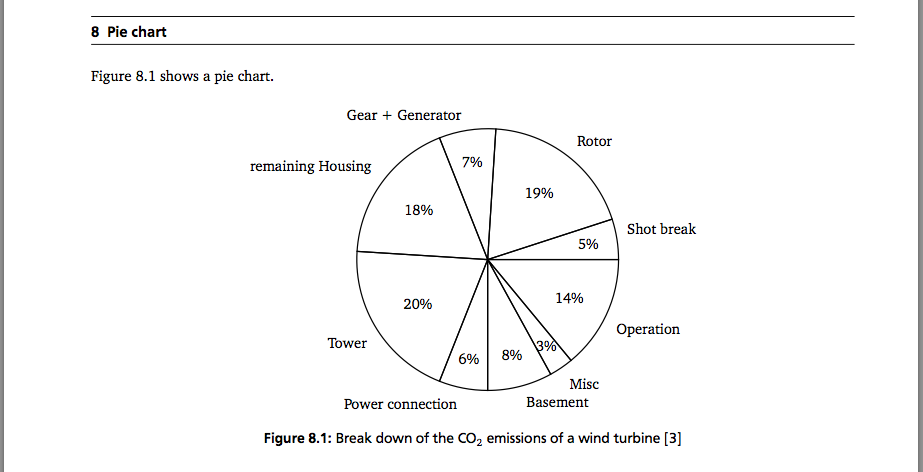
### Pie charts
255
256
257
258
259
260
261
262
263
264
265
266
267
268
269
270
271
272
273
274
275
276
277
278
279
280
281
282
283
284
285
286
287
288
289
290
291
292
\newcommand{\slice}[4]{
\pgfmathparse{0.5*#1+0.5*#2}
\let\midangle\pgfmathresult
% slice
\draw[thick] (0,0) -- (#1:1) arc (#1:#2:1) -- cycle;
% outer label
\node[label=\midangle:#4] at (\midangle:1) {};
% inner label
\pgfmathparse{min((#2-#1-10)/110*(-0.3),0)}
\let\temp\pgfmathresult
\pgfmathparse{max(\temp,-0.5) + 0.8}
\let\innerpos\pgfmathresult
\node at (\midangle:\innerpos) {#3};
}
\begin{figure}[htb]
\centering
\begin{tikzpicture}[scale=3]
\newcounter{a}
\newcounter{b}
\foreach \p/\t in {5/Shot break, 19/Rotor, 7/Gear + Generator, 18/remaining Housing, 20/Tower, 6/Power connection, 8/Basement, 3/Misc, 14/Operation}
{
\setcounter{a}{\value{b}}
\addtocounter{b}{\p}
\slice{\thea/100*360}
{\theb/100*360}
{\p\%}{\t}
}
\end{tikzpicture}
\caption[Break down of the CO$_2$ emissions of a wind turbine]{Break down of the CO$_2$ emissions of a wind turbine \cite{kaltschmitt2006}}
\label{fig:co2_wind}
\end{figure}
```
### Two y-axes
294
295
296
297
298
299
300
301
302
303
304
305
306
307
308
309
310
311
312
313
314
315
316
317
318
319
320
321
322
323
324
325
326
327
328
329
330
331
332
333
334
335
336
337
338
339
340
341
342
343
344
345
346
347
348
349
350
351
352
353
354
355
\begin{figure}[htb]
\centering
\begin{tikzpicture}
\begin{axis}[
ybar,
scale only axis,
xlabel= Trips in 2010,
width = 0.8\textwidth,
height = 0.5\textwidth,
ylabel= Covered distance in km,
% height = 80mm,
ymin = 0,
ymax = 800,
xmin = 0,
xmax = 111,
bar width = 0.5mm,
axis x line* = bottom,
axis y line* = left,
bar shift = -0.25mm,
y tick label style = {/pgf/number format/use comma},
legend style = {at={(0.5, 1.025)}, anchor = south east, legend columns = -1, draw=none, area legend},
area legend
]
\addplot+[mark=none, blau_2b] table[x=number, y=km] {data/ev.dat};
\addplot+[line legend, sharp plot, dashed, line width = 2pt, mark=none, draw = blau_2b] coordinates{(0,150) (111,150)};
\legend{Kilometers, max. range (150 km)}
\end{axis}
\begin{axis}[
ybar,
scale only axis,
width = 0.8\textwidth,
height = 0.5\textwidth,
axis y line* = right,
axis x line = none,
ylabel = Immobilization time between two trips in hours,
% height = 80mm,
xmin = 0,
xmax = 111,
ymin = 0,
ymax = 410,
bar width = 0.5mm,
bar shift = 0.25mm,
legend style = {at={(0.5, 1.025)}, anchor = south west, legend columns = -1, draw=none, area legend},
area legend
]
\addplot+[mark=none, gruen_4b] table[x=number, y=time] {data/ev.dat};
\addplot+[line legend, sharp plot, dashed, line width = 2pt, mark=none, draw = gruen_4b] coordinates{(0,8) (111,8)};
\legend{Immobilization time, Charging time (8h)}
\end{axis}
\end{tikzpicture}
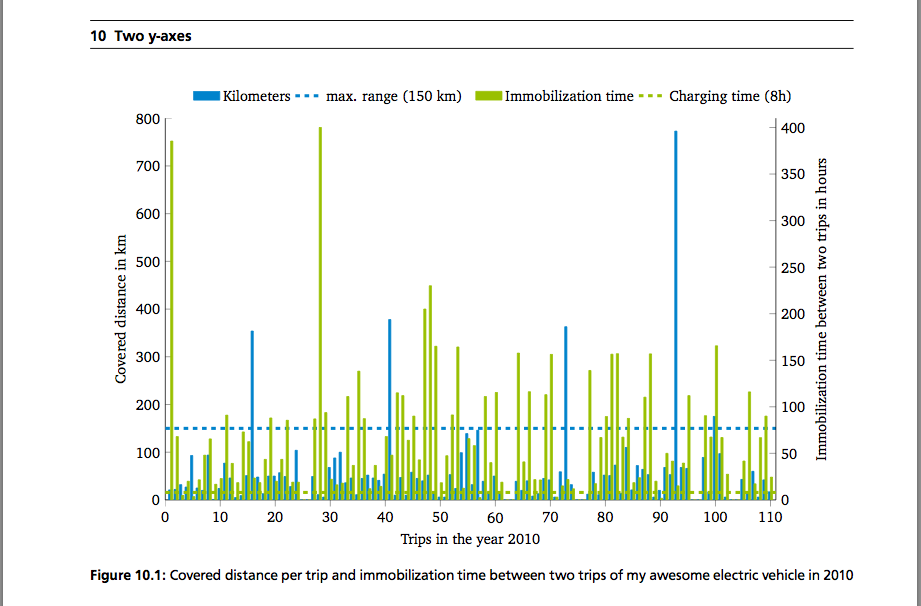
\caption[Covered distance and immobilization time between trips of my awesome electric vehicle]{Covered distance per trip and immobilization time between two trips of my awesome electric vehicle in 2010}
\label{fig:trips_ev}
\end{figure}
```
### Text replacement
Before
357
358
359
360
361
362
363
364
365
366
367
368
369
370
371
372
373
374
375
376
377
378
379
380
381
382
383
384
385
\begin{figure}[htb]
\centering
\subfloat{
\psfrag{a}[c][c]{$\theta$}
\psfrag{b}[c][c]{$\Sigma$}
\psfrag{c}[c][c]{Incidence angle}
\centering
\includegraphics[width=70mm]{images/collector_theta-01.eps}
}\hspace{1cm}
\subfloat{
\psfrag{S}[c][c]{S}
\psfrag{N}[c][c]{N}
\psfrag{a}[c][c]{$\Sigma$}
\psfrag{b}[c][c]{$\beta$}
\psfrag{c}[c][c]{$\phi_\textnormal{S}$}
\psfrag{d}[c][c]{$\phi_\textnormal{C}$}
\centering
\includegraphics[width=90mm]{images/collector_geometry-01.eps}
}
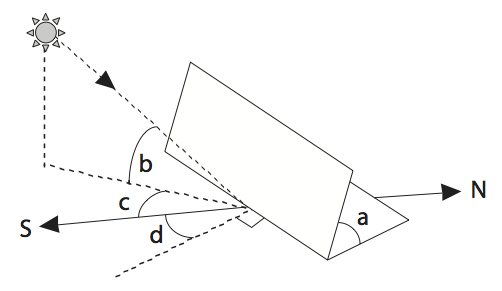
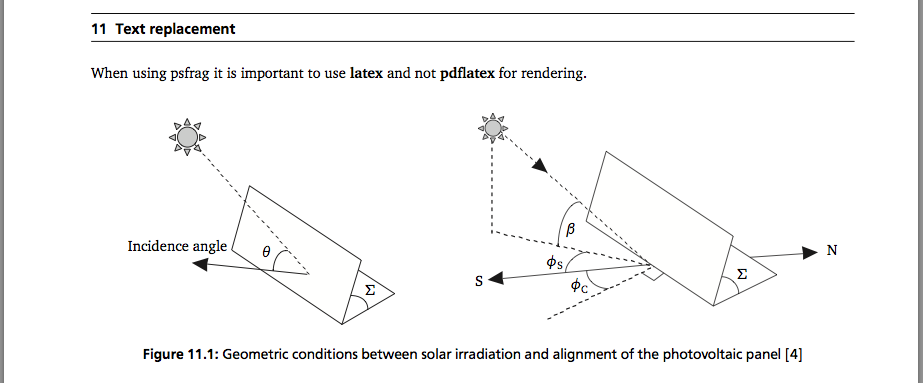
\caption[Geometric conditions between solar irradiation and alignment of the photovoltaic panel]{Geometric conditions between solar irradiation and alignment of the photovoltaic panel \cite{masters04}}
\label{fig:collector}
\end{figure}
```
After
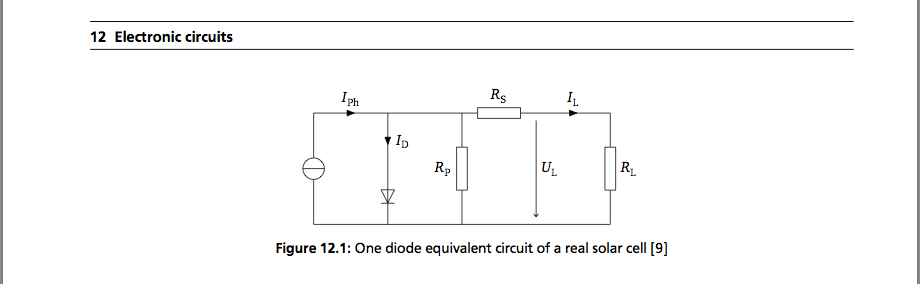
### Electronic circuits
\begin{tikzpicture}[
circuit ee IEC,
set inductor graphic=var inductor IEC graphic,
scale = 0.85,
]
\draw (0,0) to [current source] (0,3);
\draw (0,3) to [current direction={info=$I_\textnormal{Ph}$}] (2,3);
\draw (2,3) -- (4,3);
\draw (2,3) to [current direction={info={$I_\textnormal{D}$}}] (2,1.5) to [diode] (2,0);
\draw (0,0) to (8,0);
\draw (4,0) to [resistor={info={$R_\textnormal{P}$}}] (4,3);
\draw (4,3) to [resistor={info={$R_\textnormal{S}$}}] (6,3);
\draw (6,3) to [current direction={info={$I_\textnormal{L}$}}] (8,3);
\draw (8,3) to [resistor={info={$R_\textnormal{L}$}}](8,0);
\draw [->] (6,2.8) -- (6,0.2);
\draw (6,1.5) node[anchor=west]{$U_\textnormal{L}$};
\end{tikzpicture}
```